
Accurate reports and analytics are the foundation of sound e-commerce business decisions. However, in today’s fast-paced business environment, keeping track of all the information coming from different sources can be challenging. E-commerce businesses often struggle to keep up with the vast amount of data they need to process, leading to difficulties in understanding and using all the information.
Eliminating Inaccuracy in Business Reports and Analytics
Flawed data can lead to poor decision-making and ultimately hurt the bottom line of any business. The solution to this problem is to have a centralized panel or dashboard that consolidates all of your e-commerce processes and shares more accurate business data and reports in one place.
This improves the efficiency and accuracy of your data and analytics, allowing you to make better strategic decisions for your business. Let’s explore the key metrics a centralized e-commerce dashboard should include and how it can help you streamline your e-commerce business operations.
4 Critical Metrics You Must Track in E-commerce KPI Dashboard
Here are some key metrics that a centralized e-commerce KPI dashboard can track to help you grow your business:

1. Channel-Wise Performance
The rise of online marketplaces has dramatically expanded the choices available to customers, making it more important than ever for businesses to have a presence across multiple channels like online marketplaces and D2C websites. Multi-channel sales analysis is crucial for e-commerce businesses to understand and optimize their sales across different channels.
Channel-wise performance reports can help you identify which channels drive the most revenue for your business, which products sell well in which marketplace, and which channels are most profitable. It also helps businesses gain insight into which channels are driving the most sales.
By analyzing the data, they can make informed decisions on where to focus their business and marketing efforts. This can help them to maximize their return on investment by avoiding over-investing in channels that are not as effective.
2. Total Revenue
As an e-commerce business, tracking your revenue is crucial to understanding the overall performance of your online sales. One of the most important metrics to monitor is Total Revenue, which provides a clear picture of how much revenue is being generated by the business on a daily and monthly basis.
By tracking Total Revenue, businesses can gain insights into which products are selling well and which promotional strategies are most effective. It also helps businesses identify potential issues or bottlenecks in their sales process. For example, a sudden drop in revenue could indicate a problem with the website or checkout process, while a steady decline in revenue over time could indicate a more serious problem, such as a decline in customer interest or a lack of innovation in product offerings.
3. Total Orders (Per Day)
Keeping a close eye on the number of transactions made on your platform is essential to understanding the demand for your products. With features like Total Orders (Per Day), you can easily measure the daily number of transactions made on your sales platforms.
This metric provides insight into the demand for products and can be used to identify patterns in consumer behavior, such as peak buying times, which can help them optimize their marketing and sales strategies. It also helps retailers comprehensively understand their transaction data, including the number of orders, revenue, and average order value.
4. Alerts
An e-commerce dashboard can send various notifications to sellers to help them make data-driven decisions for their business. Here are some of the important ones:

- Order Alerts
Order Alerts are a vital aspect of e-commerce management as they help businesses stay informed about the status of orders and act quickly to resolve any issues that may arise. These alerts can include metrics such as delayed orders, failed orders, and more.
They also help businesses monitor compliance with SLAs (service level agreements) and other performance metrics such as order-fulfillment times, tracking numbers, and shipping methods, allowing them to identify and address issues with logistics partners and vendors.
- Product Alerts
Product alerts inform retailers of issues with their products, such as failed inventory syncs, failed price syncs, and disabled inventory. These alerts are important for businesses to stay informed and take action quickly to resolve any issues that may arise with their products.
A single e-commerce KPI dashboard allows quick notifications of discrepancies between e-commerce platform inventory and actual inventory, issues with updating product prices on sales platforms, and monitoring disabled products due to lack of stock or removal.
- Channel Alerts
Channel alerts are a secret weapon to ensure that sales channels are configured and working properly. These notifications inform businesses when there is a problem with the integration between the warehouse management system and a specific sales channel.
This can happen when there is a broken connector between the WMS and the channel or an issue with the data being passed between the two. Channels pending to be configured alerts will inform the retailers when they still need to set up certain sales channels on their WMS.
Must-Track Reports for Every E-commerce Business
Here are the essential e-commerce reports every store owner should be monitoring to maximize online sales:
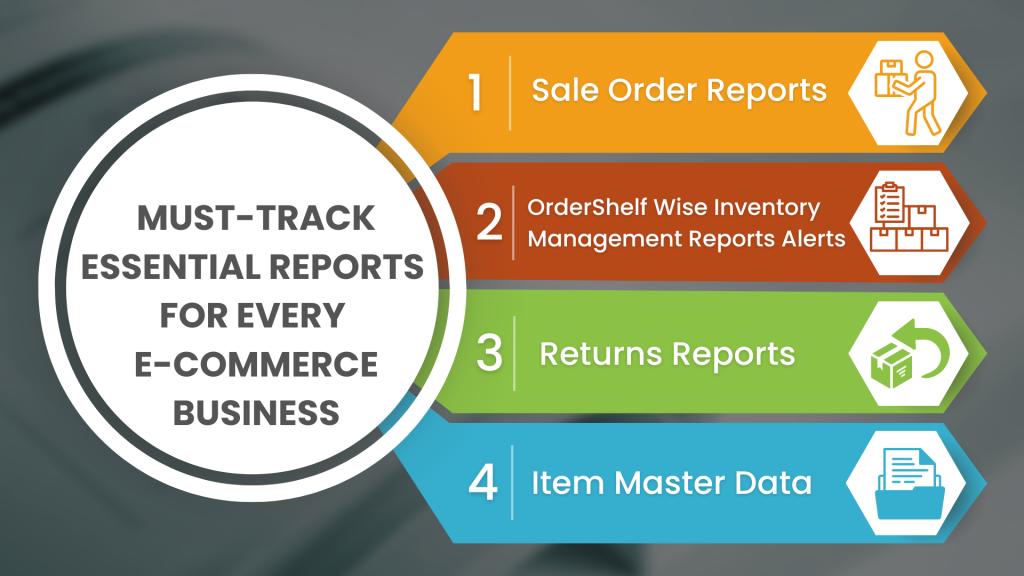
1. Sale Order Reports
Sale Order Reports provide a detailed breakdown of all the sales that have taken place in your business. This report includes information such as the number of orders placed, the total revenue generated, the average order value, and the number of items sold.
It can also provide access to payment-related information and allow you to calculate your net earnings efficiently. By monitoring these reports, retailers can gain valuable insights into their customers’ purchasing habits and identify trends or patterns in their sales.
If you’re engineering in-house dashboards, developer tools for .NET and JavaScript provide production-ready grids, charts, pivot tables, and exporters to visualize sales orders, analyze AOV, and build drill-down reports faster—ensuring your KPI panels mirror real-time performance.
2. Shelf Wise Inventory Management Reports
Streamline your inventory management and stay on top of stock levels with Shelf Wise Inventory Management Reports. These reports comprehensively analyze inventory counts across all of your warehouses, allowing you to easily identify areas where stock is running low or where overstocking may be an issue.
The report covers shelf tolerance, product quantity on hand vs. capacity, batch information (expiry, manufacturing date), and other relevant details. By using an e-commerce KPI dashboard, you can easily access these reports and keep track of your inventory across all channels.
Businesses can use this information to make data-driven decisions on when to restock and how much to order, helping you to avoid stockouts and overstocking.
3. Returns Reports
Returns are an inevitable part of e-commerce, but with the right tools and analysis, they can provide valuable insights into a business’s performance. A Return Report is a powerful tool that can help businesses understand the source of returns, such as customer-initiated and courier-initiated.
Knowing the source of returns enables identifying the reasons behind them. For example, courier-initiated returns may be due to the shipping provider not covering certain pin codes or incorrect order addresses, while customer-initiated returns may result from factors such as product expiration, damaged product, or incorrect SKU.
By understanding the causes of returns, businesses can take action to reduce returns, enhance customer experience, and maintain business standards. An e-commerce KPI dashboard can be used to track and analyze return metrics, providing businesses with a clear view of their return performance.
4. Item Master Data
Item Master Data is a critical component of e-commerce operations as it contains all the relevant information about a product, including its name, SKU, description, pricing, and other details. This information is used to populate online catalogs and is also used to manage inventory and track sales.
It enables retailers to gain a deeper understanding of their products and how they perform in the market. It enables retailers to gain a deeper understanding of their products and how they perform in the market.
Explore how Unicommerce’s E-commerce Key Performance Indicator (KPI) Dashboard can benefit your business –
Key Takeaways!
E-commerce businesses rely heavily on accurate and up-to-date data and analytics to make strategic decisions. However, managing a large volume of information from various channels can take time and effort.
A centralized e-commerce dashboard like Unicommerce can solve this problem by consolidating all business data and reports in one place, providing a clear and comprehensive view of the business performance.
By monitoring critical metrics such as sales and revenue, customer data, product data, inventory levels, and logistics and shipping data, businesses can gain valuable insights into every stage of the customer journey and take action to optimize their e-commerce operations.
Interested in building an advanced, feature-rich ecommerce dashboard tailored to your business needs? Give our solutions expert a call today!
Related Read –
- What is Warehouse Management System?
- FMCG Industry challenges in India
- E-commerce Apparel Industry: Trends, Challenges, Opportunities & Solutions
- Footwear Industry in India: Trends, Challenges & Solutions
- Healthcare Industry in India: Trends, Challenges, Opportunities & Solutions
- Shipway by Unicommerce for Advanced Shipping Tracking Platform
- UniReco – E-commerce Marketplace Payment Reconciliation
- Key Challenges & Benefits of Marketplace Payment Reconciliation
- Benefits of Shipping Notifications
- E-commerce Shopify Integration with Unicommerce
- Why Pick List is Important for Warehouse Operations?